There's more than you've come to expect from your monitoring system
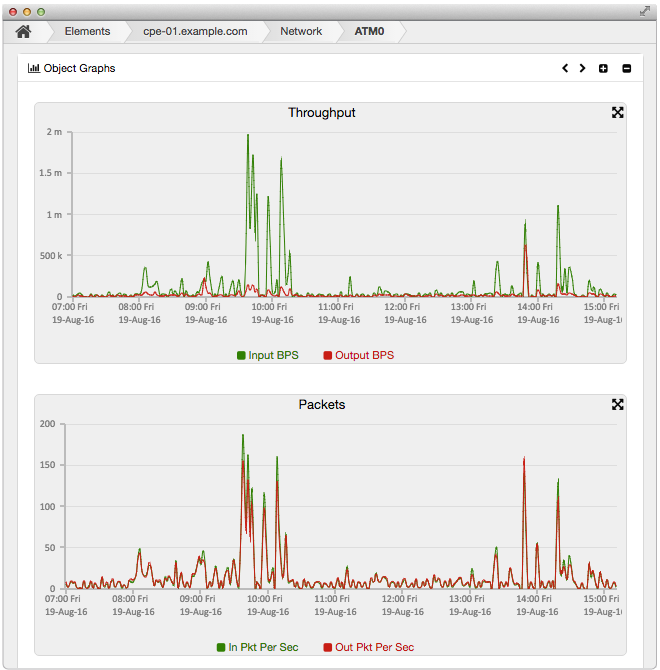
Graphing of statistical data is a fundamental feature of any monitoring system. However, some system start averaging the data samples very quickly. That saves storage space but can make the graphs pretty much useless. We've spent a lot of time ensuring our graphs are as useful as they are good looking.
Network Knowledge collects data samples every 60 seconds. Unlike other monitoring systems, it keeps those samples at 60 second granularity for a year. Many systems can only show 5 or 10 minute averages once the data is a few days old. Averaging your data reduces it's value dramatically so we don't do it until the data is at least a year old.
Collecting data samples every minute can generate a huge amount of data. We've developed a storage technique we call an Aggregated Time Series that allows us to save lots of storage space. Network Knowledge gives you great graphs at fine granularity with efficient data storage.


While Network Knowledge is collecting your statistical data, it also collects as much related information as possible. That information is stored and any changes are tracked. Through the Web GUI you can view current information for an object, walk back in time through previous versions, or run queries over the entire data set.
Do you know which of your switch ports are in a particular vlan? Or which routers are running a certain version of software? How about what SSL certs expire this year? Would you like to know what changes have been seen in the last 10 minutes? Information tracking is a key feature of Network Knowledge. Read more about it here.
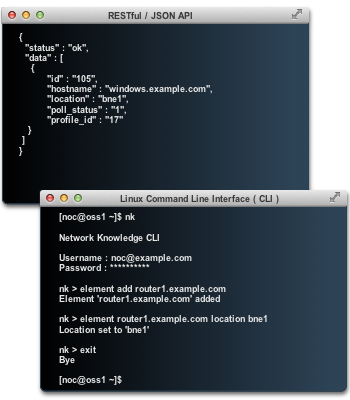
People work in different ways and want to achieve different things with our software. To ensure we fit your requirements we provide 3 ways to interact with Network Knowledge.
In addition to the Web base GUI we provide a linux based Command Line Interface (CLI). Use it interactively or call it in batch mode from a script. Providing a simple and convenient way to script tasks with Network Knowledge opens up a world of possibilities.
Both the Web GUI and the CLI access the intelligence of Network Knowledge via a JSON based Web API. We publish the details of that API so that you can integrate Network Knowledge directly into your other systems.


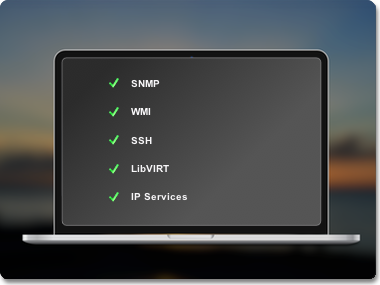
A modern IT platform is built from a wide range of different technologies. The days of running just one type of system are long gone. You need a monitoring system that can deal with all your equipment.
Network Knowledge uses a modular architecture so data and information can be collected from virtually any type of system. Our data collectors provide an abstraction layer so that we can support any data collection technology.
We provide a wide range of data collectors out of the box to support networking hardware, Linux, Windows, and virtualisation stacks. Or if you have unusual requirements, writing your own data collector is easy. Our developers kit is included with the product.
Flexible permissions management lets you control access to features per user. User and element grouping lets you control what devices a user sees - great for teams or providing access to customers.
The modular design lets you add new object classes to extend what you want to monitor. Using our existing data collectors makes adding support for new objects easy.
Our Info Console lets you build custom queries to search through the operational info of your infrastructure. This incredibly powerful tool is at the heart of Network Knowledge. More ...